
Cities & urban heat
Urban OS
Residents mark what is wrong on a map, in Bangla. Planners see those pins next to the satellite data, on one screen.
The product
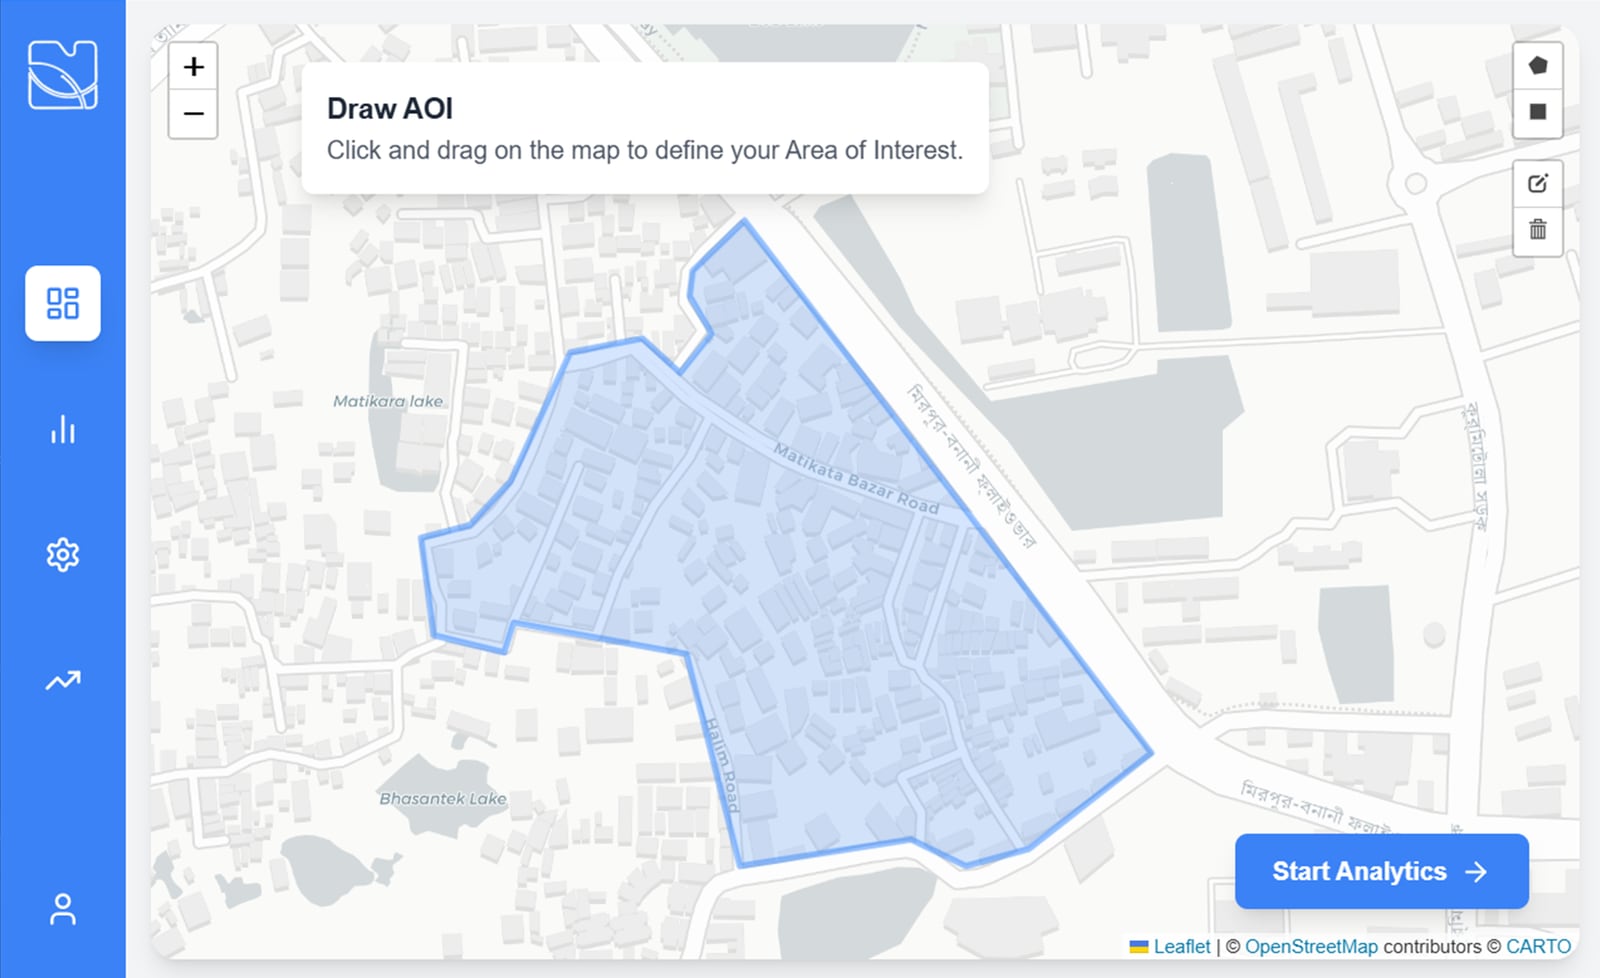
Draw the area. Everything after this is calculated for that boundary.
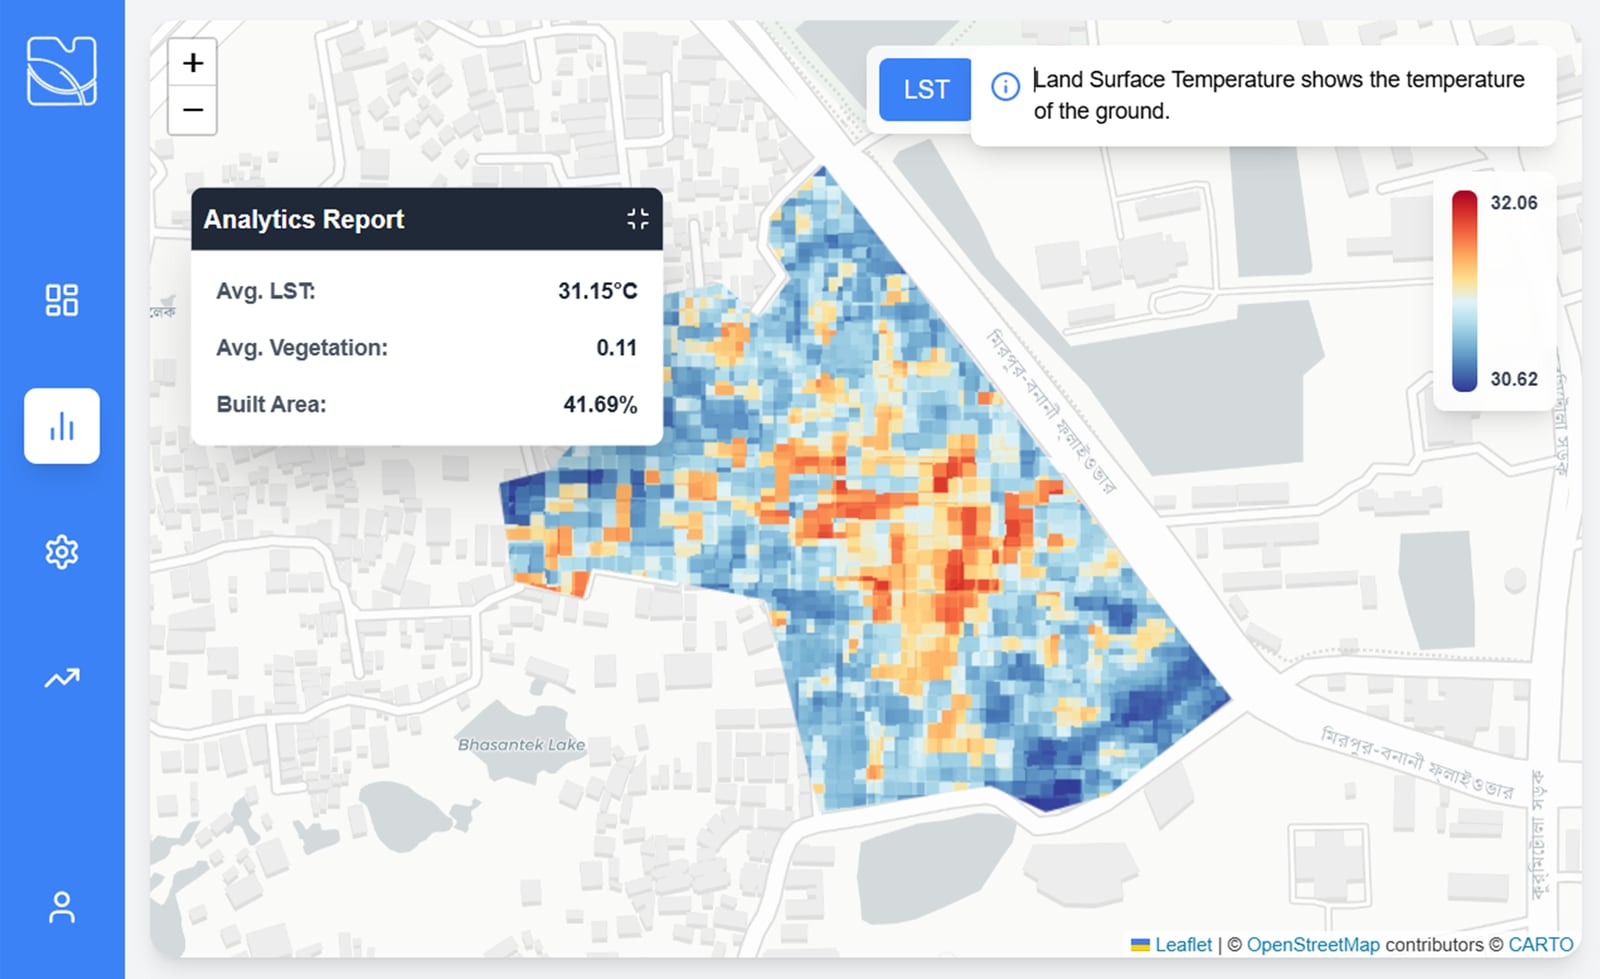
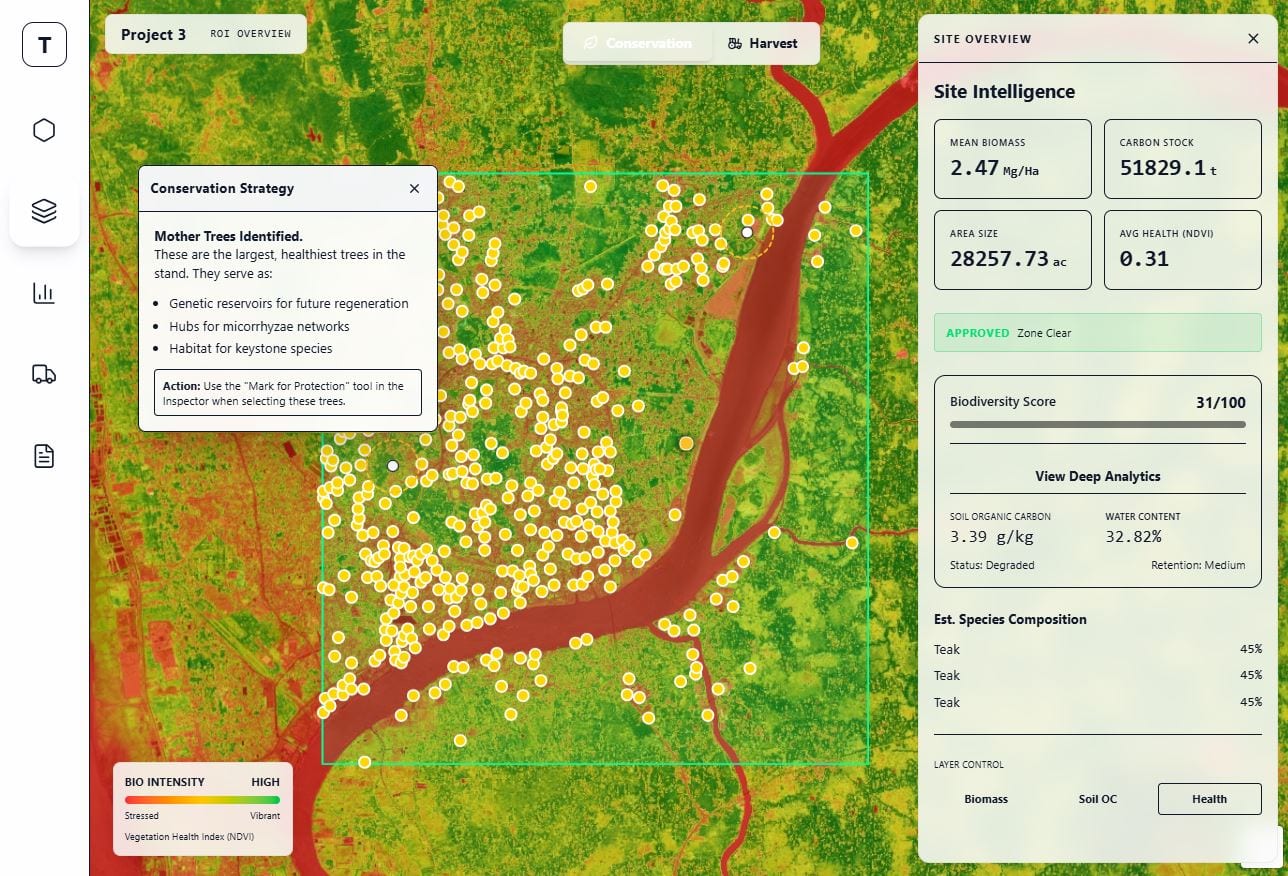
Land surface temperature. 31.15°C average, vegetation index 0.11, built area 41.69%.
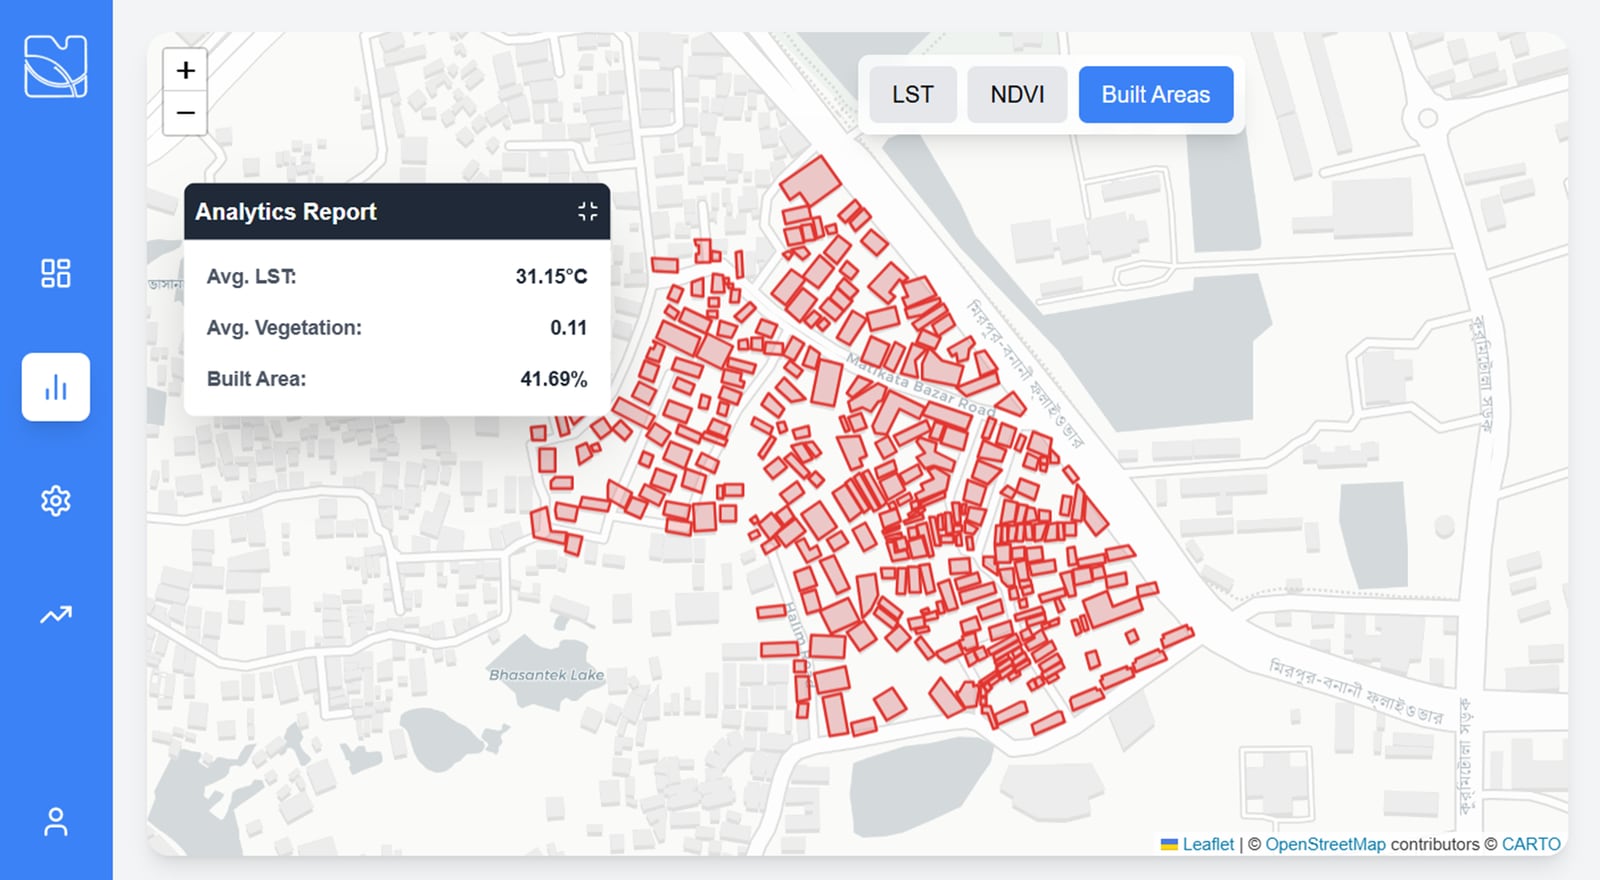
Footprints, detected from imagery. Measured rather than estimated.
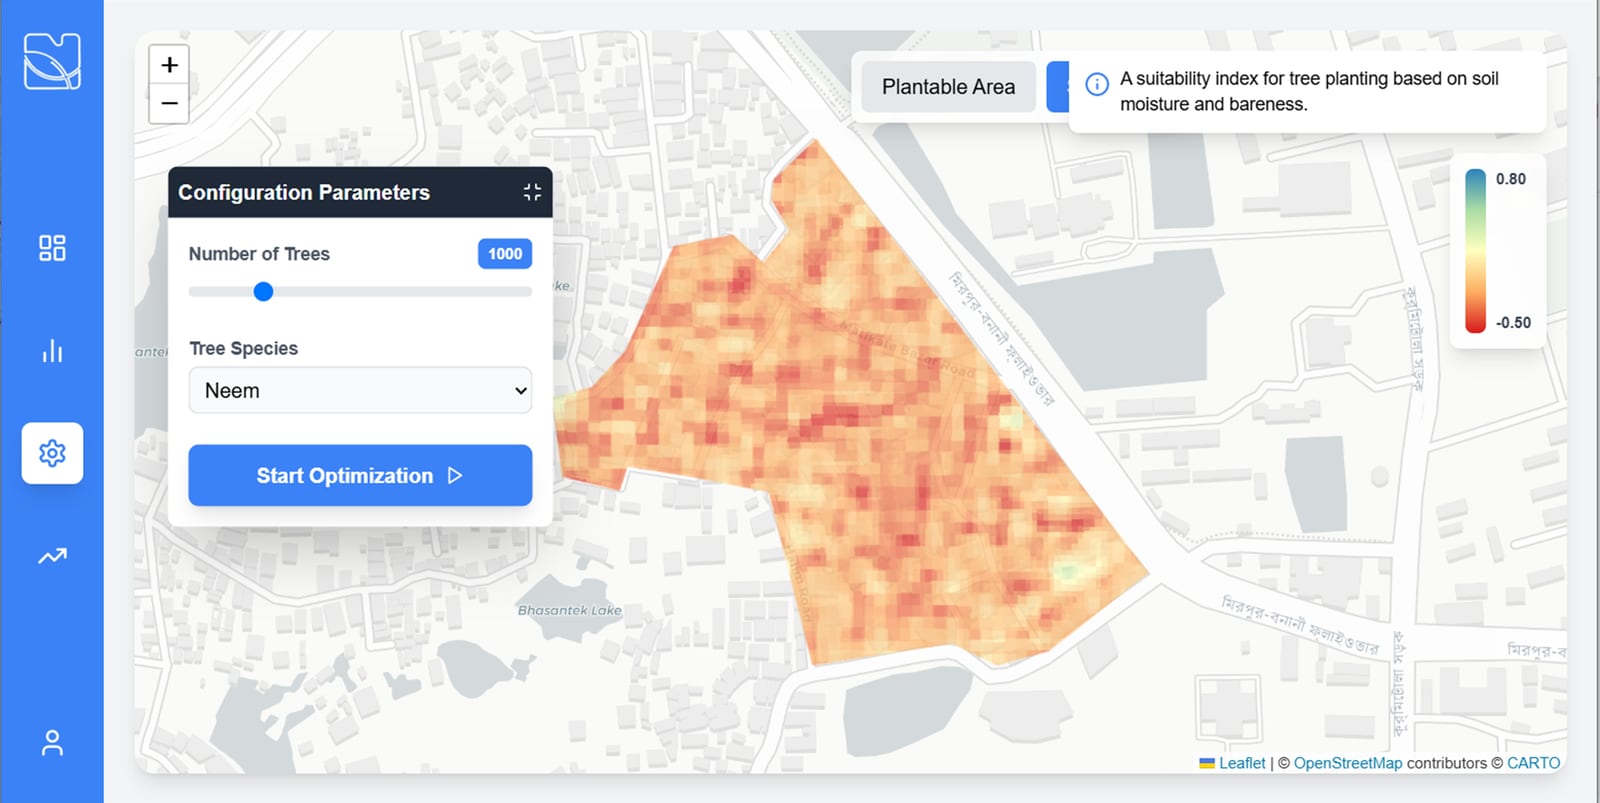
Plantable area. Set the count and the species; the optimiser places them.
How it works
01
Someone opens the app
Projects near them, on a map, in Bangla.
02
They drop a pin
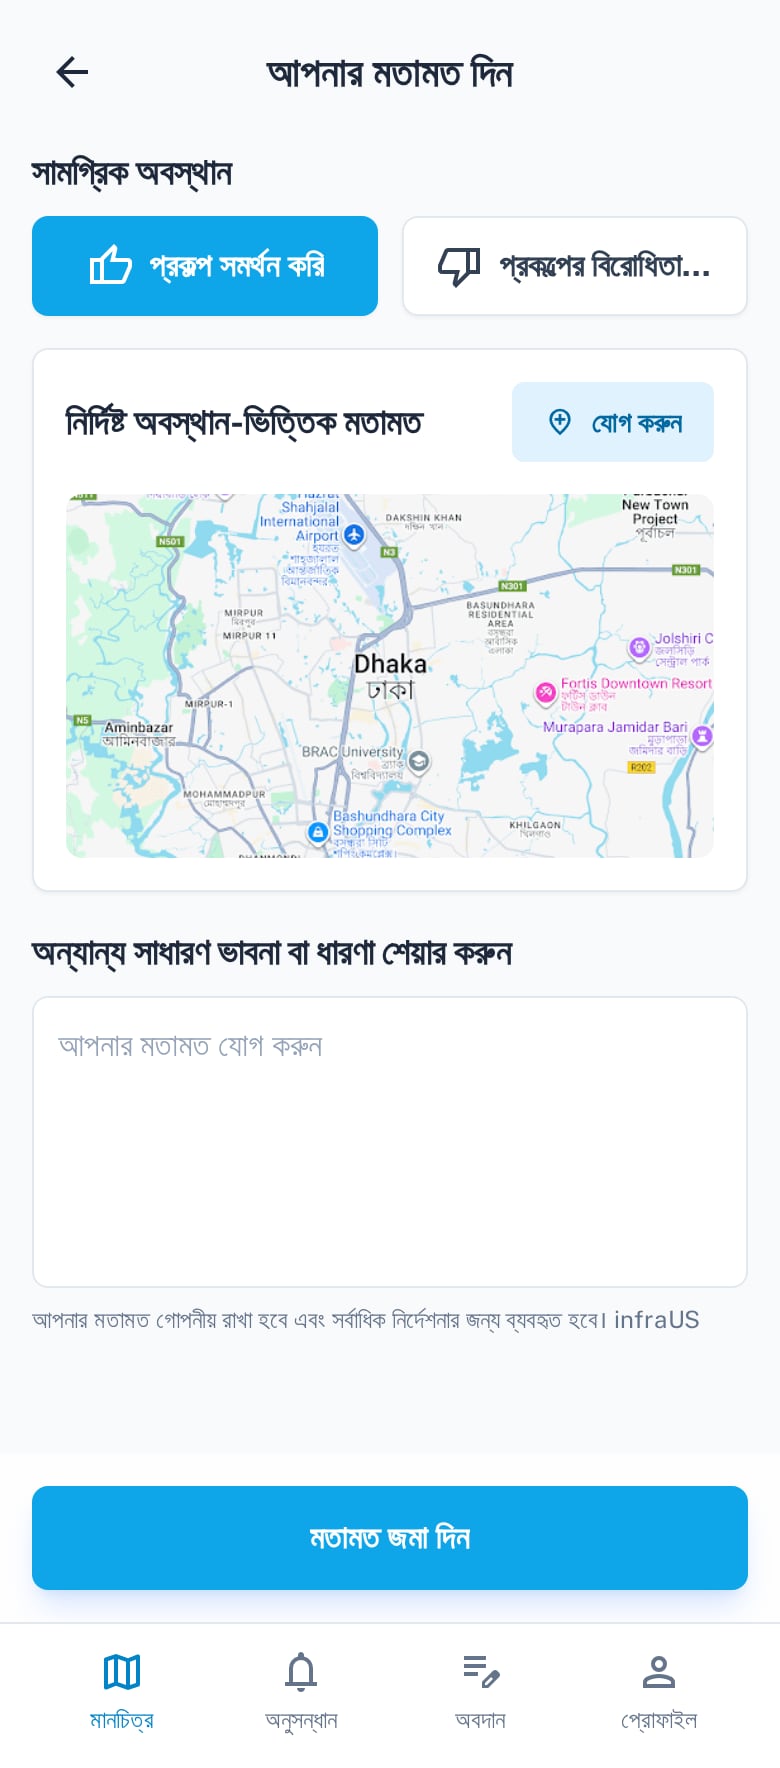
Agree, object, or point at the right spot.
03
A planner draws the area
One boundary scopes everything downstream.
04
The satellite fills it in
Heat, greenery and built-up area.
05
The optimiser answers
Where the trees go, how many, which species.
What a resident sees
infraUS
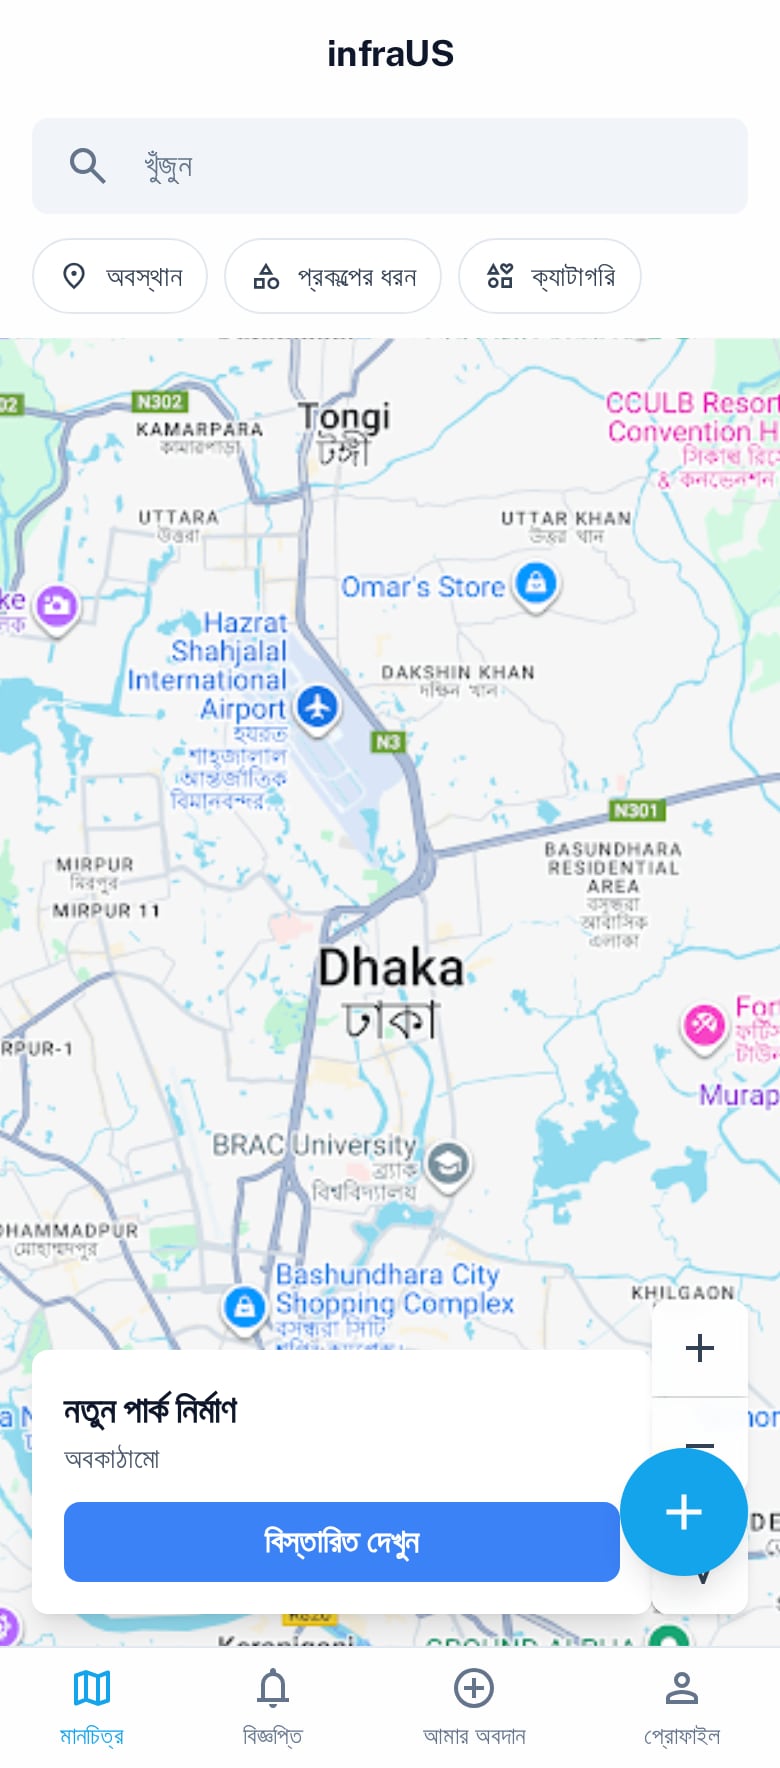
Bangla first, not translated at the end. It opens on their own area, and the main action is one tap.

Where it stands
In pilot
Greenery placement across the University of East London campus — a small site with real constraints.
Backed at home
Government funding through the ICT Division and Startup Bangladesh.
Next
More city corporations, and better Bangla comment analysis. It decides whether people feel heard.
The margin
Roughly 1–2°C cooler for every 1% added to a city’s tree canopy.
Want this where you are?
We would rather have it running somewhere useful than sitting in a demo.