The work

Five tools, running now.

Different users, different problems, one method: start with the person who has the problem, use data that already exists, test it somewhere real.

FIG 0.1  /  Cities & urban heat

Urban OS

Residents' pins and satellite heat on one screen.

Open Urban OS
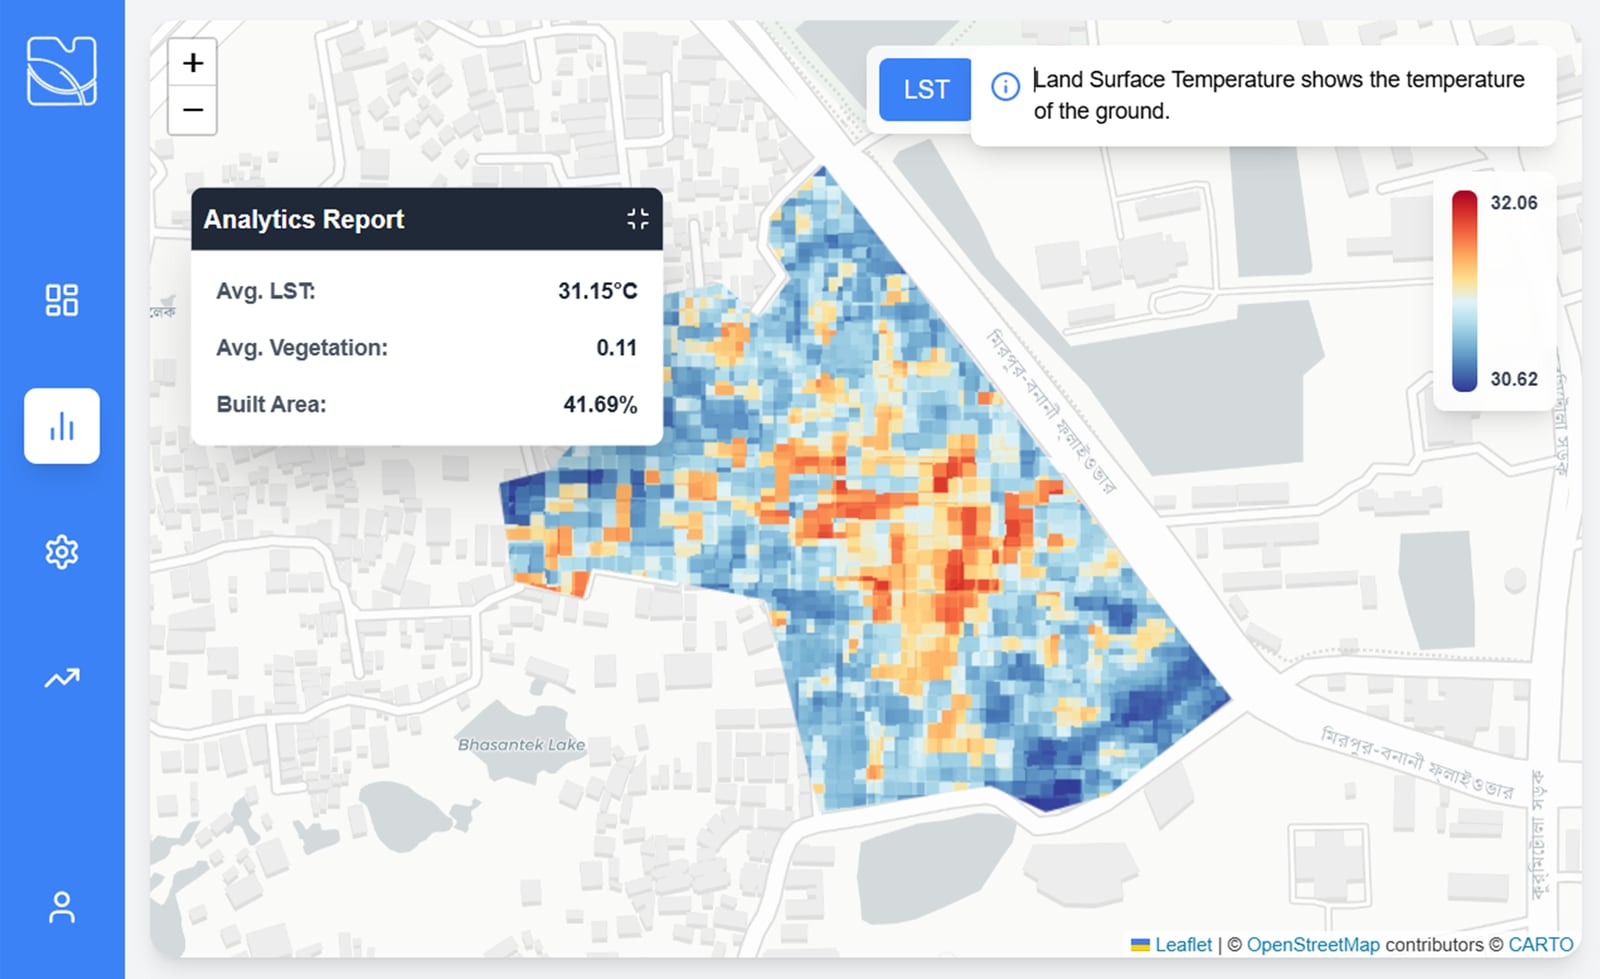
infraGOV showing land surface temperature over a Dhaka neighbourhood, with an analytics report panel
Urban OS FIG 0.1

FIG 0.2  /  Forestry

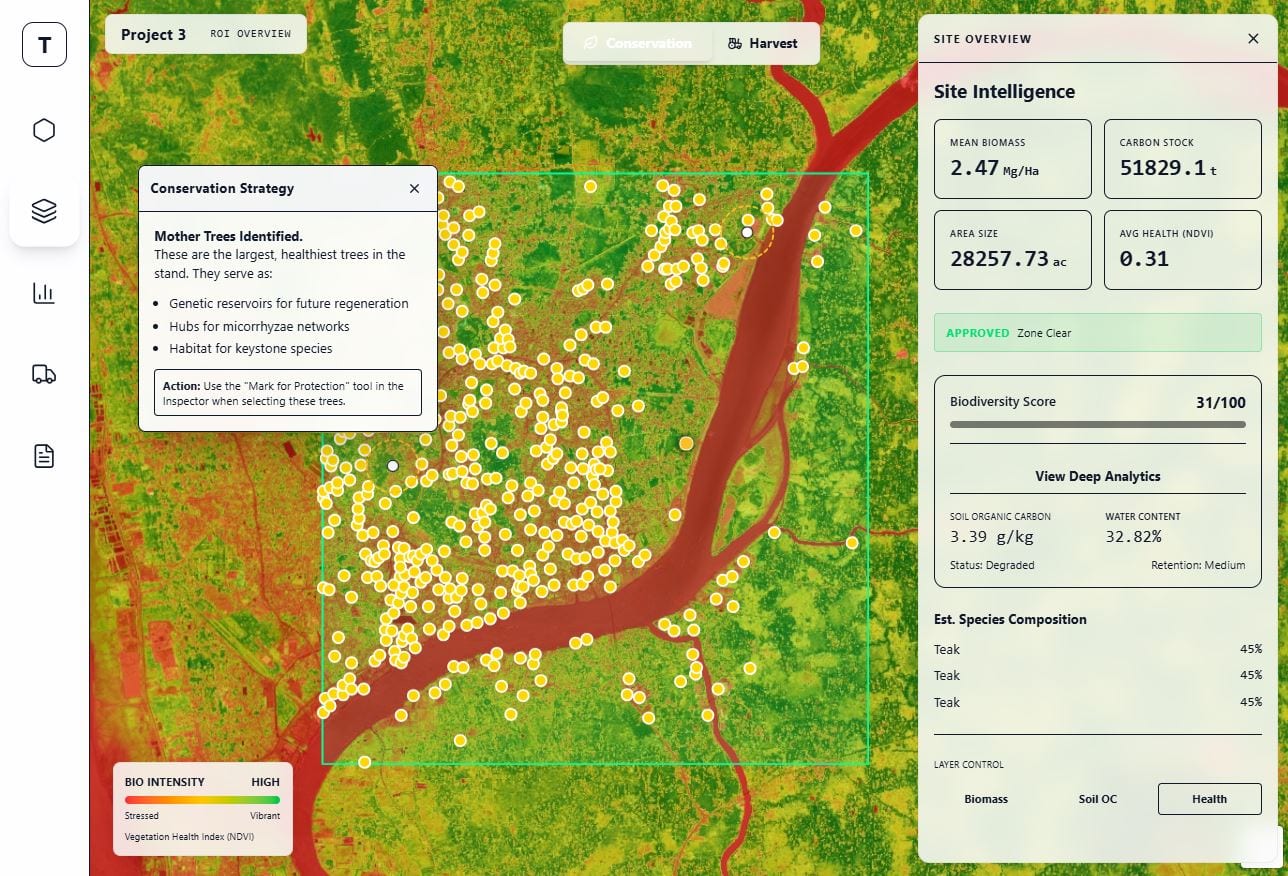
Temeter

Plan a harvest that leaves the forest standing.

Open Temeter
Temeter's site intelligence panel: biomass, carbon stock and biodiversity score over a satellite view
Temeter FIG 0.2

FIG 0.3  /  Biodiversity

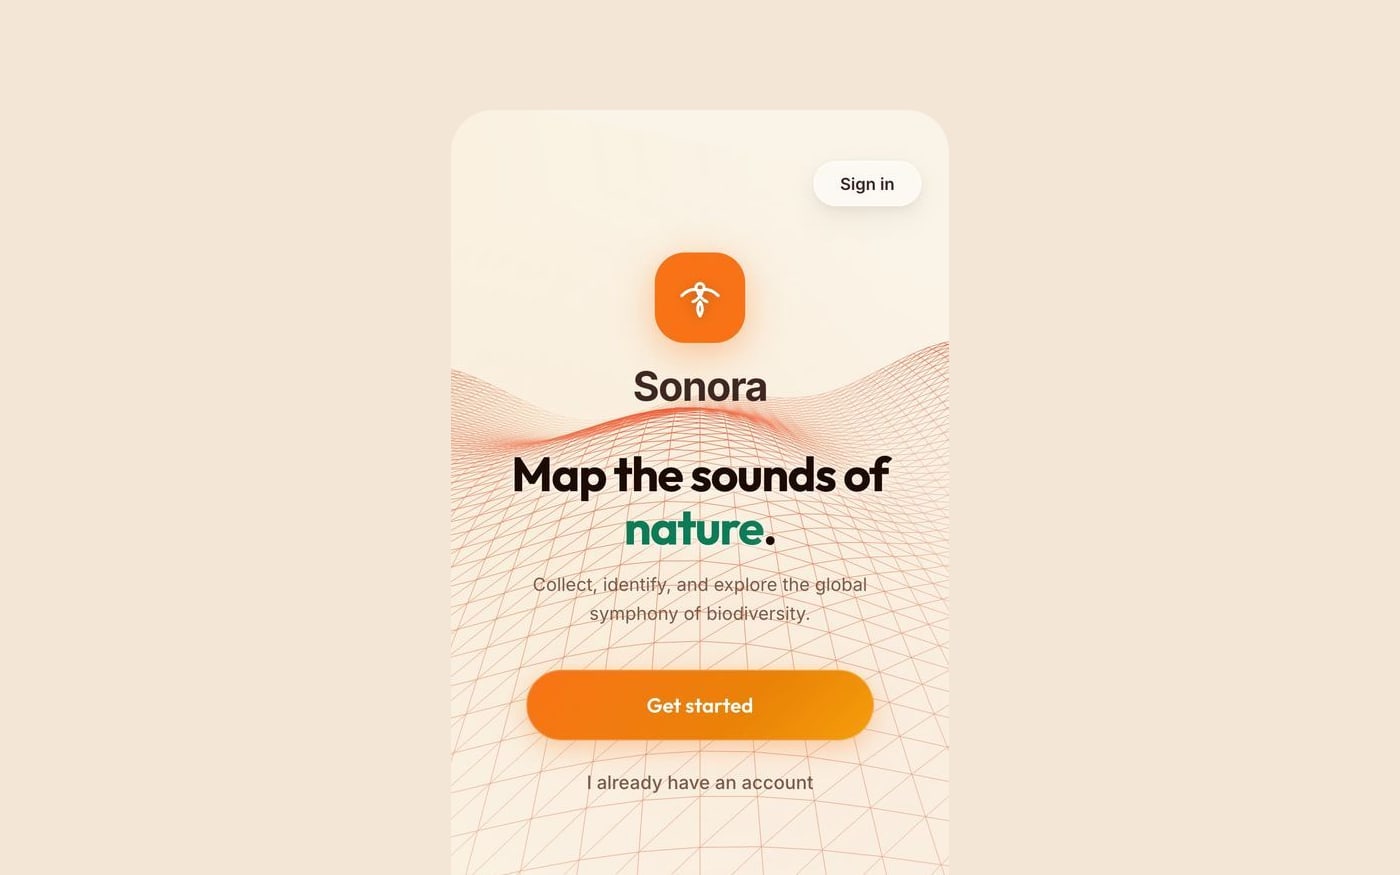
Sonora

A map of what nature sounds like.

Open Sonora
The Sonora app opening screen: map the sounds of nature
Sonora FIG 0.3

FIG 0.4  /  Coastal farming

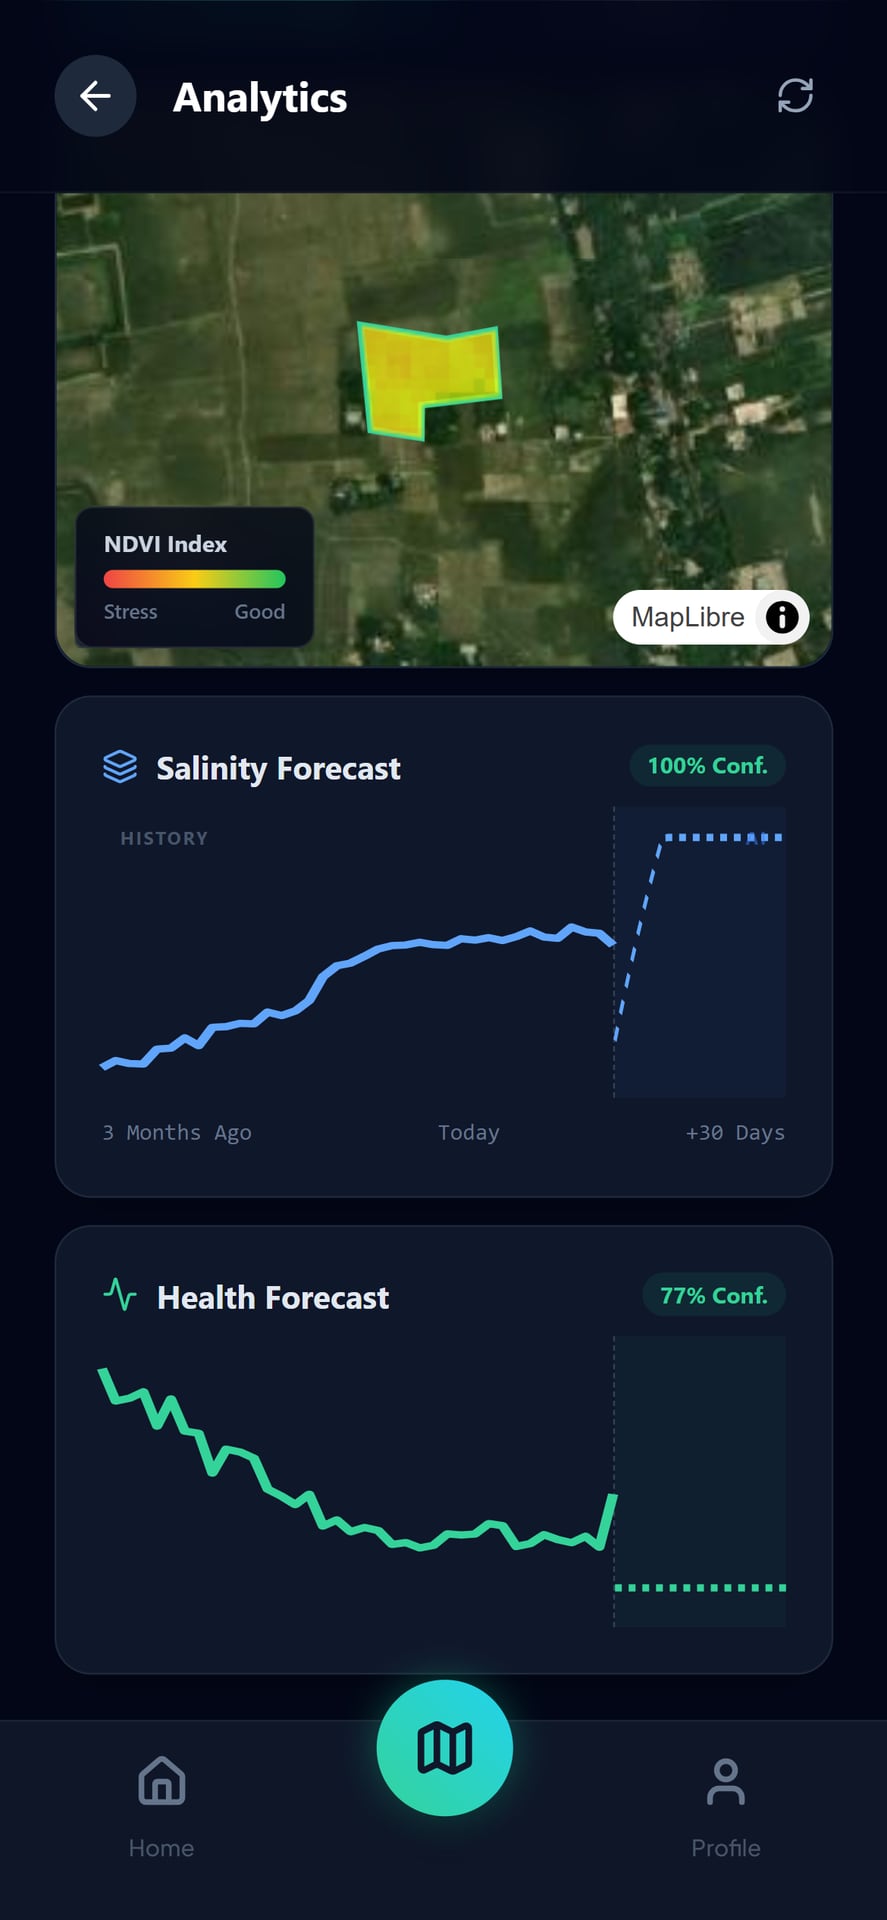
Urbor

Salt-damaged farmland, brought back into use.

Open Urbor
The Urbor app's analytics screen: an NDVI index over a plot, a salinity forecast and a health forecast
Urbor FIG 0.4

FIG 0.5  /  Education

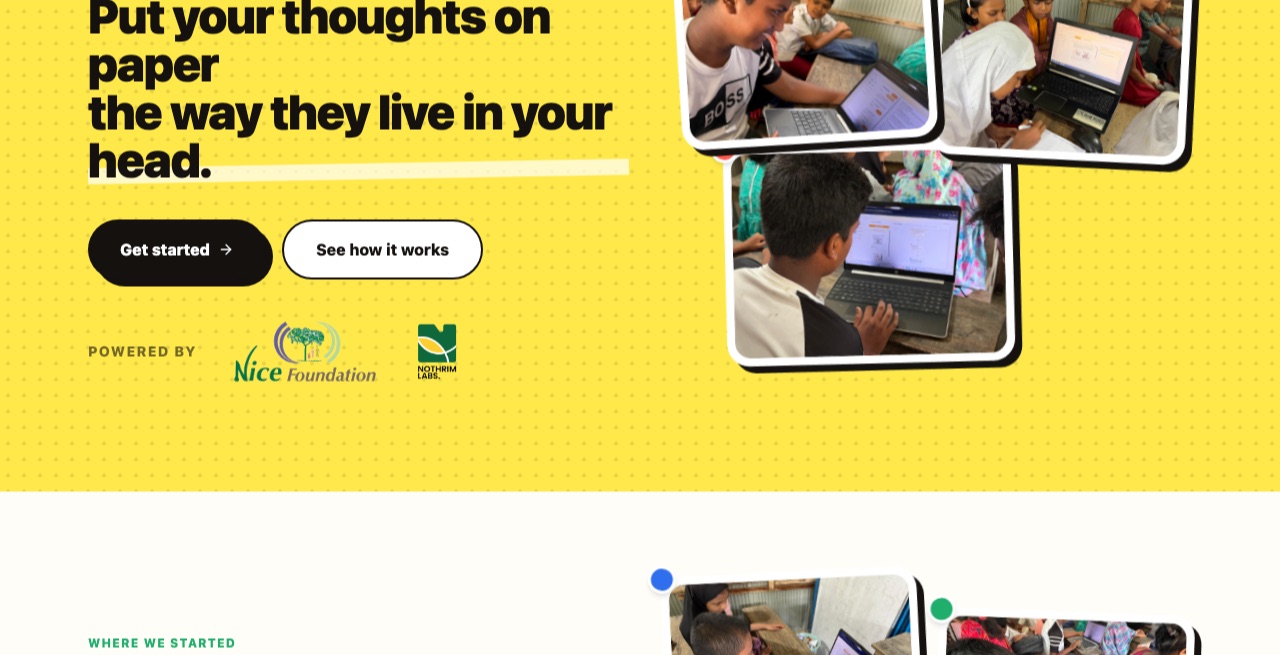
anhik.ai

A notebook that shows how a teacher thinks.

Open anhik.ai
The anhik.ai web app at anhik.com, showing students working through lessons on shared laptops
anhik.ai FIG 0.5

None of these quite fit?

Tell us the problem anyway. What we build next usually starts as one of these conversations.